
1. Introduction to Energy Level Diagrams
Energy level diagrams are pictorial representations which show the energy changes during a chemical reaction. They help visualize the changessin energy between reactants and products, and tell us whether a reaction is exothermic or endothermic. These diagrams typically have the enthalpy (H) or energy on the vertical Y axis and the reaction progress on the horizontal X axis .They are also known as Reaction Path Diagrams.
2. Types of Processes: Endothermic and Exothermic
Energy transfer happens in a Chemical reaction.
Chemical reactions can be classified as endothermic or exothermic based on their energy changes.
2.1 Endothermic Process
An endothermic reaction absorbs energy from the surroundings, usually in the form of heat, causing the temperature of the surroundings to fall down. This process takes in heat during the process.
- Energy is used meaning is taken in to break bonds.
- Products have higher energy than reactants.
- Enthalpy change (ΔH) is positive.
Examples:
- Photosynthesis: Plants absorb sunlight to produce glucose.
- Boiling water: Energy is taken into change liquid water to steam.
- Decomposition of calcium carbonate is an endothermic process

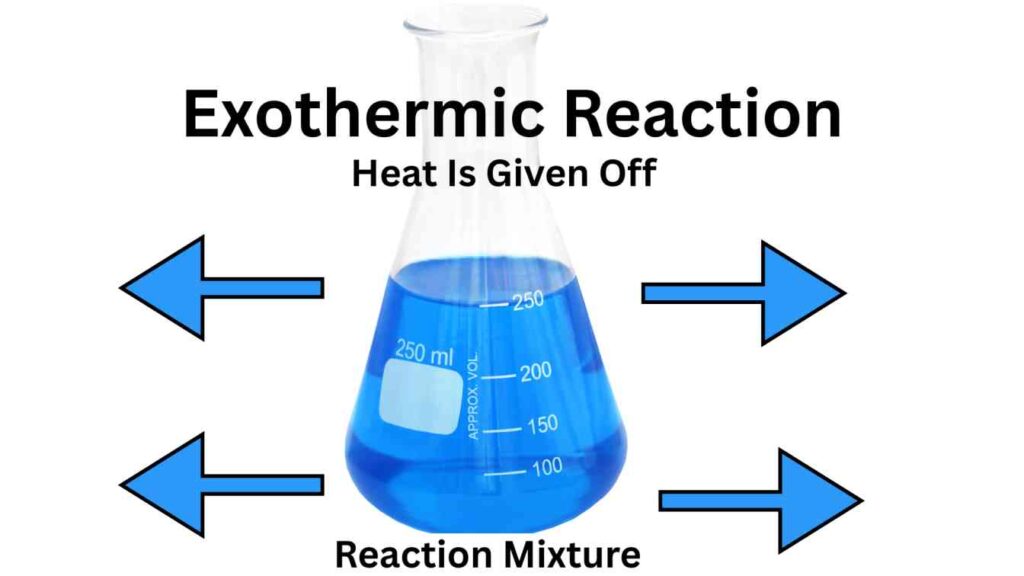
2.2 Exothermic Process
An exothermic reaction gives out energy to the surroundings, usually in the form of heat and increases the temperature of the surroundings.
- Energy is released when new bonds are made.
- New Products have lower energy than reactants.
- Enthalpy change (ΔH) is negative.
Examples:
- Combustion of methane: CH4+2O2= CO2+2H20
- Freezing of water: Energy is released as liquid water converts into ice.
- Neutralization reaction: Acid + Base Give Salt and Water.
3. Exothermic Process Energy Level Diagram
An exothermic reaction releases heat energy into the surroundings, causing the temperature of the surroundings to increase.
In an energy level diagram for an exothermic reaction:
- The reactants will have higher energy than the products.
- Energy is given out as new bonds are formed.
- The enthalpy change (ΔH) is negative, indicating a loss of energy.
Example: Combustion of Magnesium
Magnesium burns in air (oxygen) to form magnesium oxide, releasing a large amount of energy.
Graphical Representation for MgO:An energy level diagram will show the reactants (Mg and O₂) at a higher energy level, with the products (MgO) at a lower energy level, indicating the release of energy.
4. Endothermic Process Energy Level Diagram
An endothermic reaction absorbs energy from the surroundings, causing the temperature of the surroundings to drop. In an energy level diagram for an endothermic reaction:
- The products have higher energy than the reactants.
- Energy is absorbed to break bonds.
- The enthalpy change (ΔH) is positive, indicating an increase in energy.
Example: Thermal Decomposition of Calcium Carbonate
This reaction requires heat to proceed, making it an endothermic process.
5. What is Enthalpy and Enthalpy Change?
Enthalpy (H) is the total heat content of a system. It represents the energy stored in the chemical bonds of a substance.
Enthalpy change (ΔH) is the difference in enthalpy between the reactants and the products:
- Negative ΔH: Exothermic reaction (heat is released).
- Positive ΔH: Endothermic reaction (heat is absorbed).
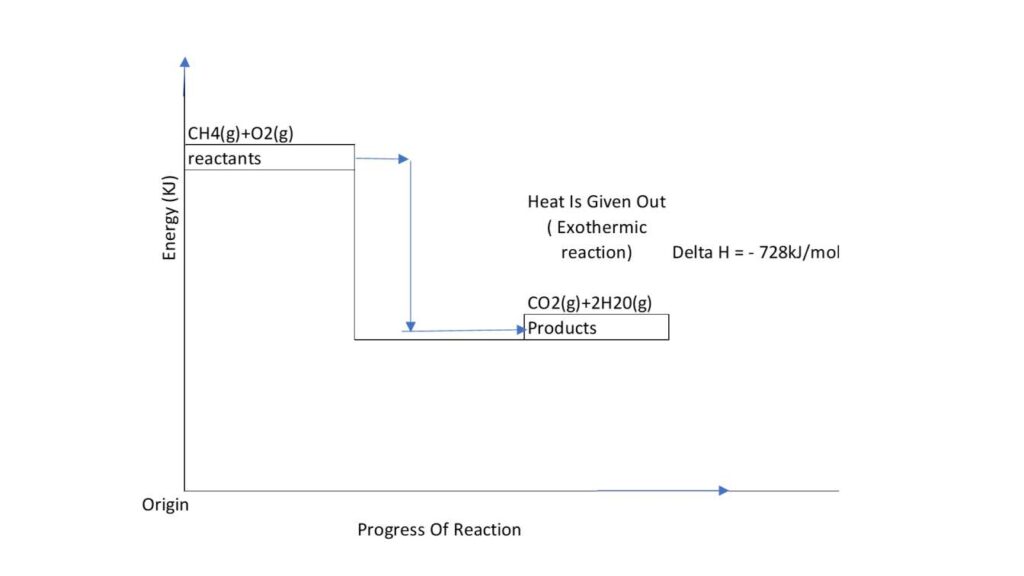
6. Energy Level Diagram for Methane Combustion
Methane combustion is an exothermic reaction:
Energy Level Representation:
- Reactants (CH₄ and O₂) have high energy.
- Products (CO₂ and H₂O) have lower energy.
- ΔH is negative, indicating energy release.
7. Bond Breaking and Bond Making
Bond making and bond breaking are fundamental concepts in chemistry.
Bond breaking requires energy because atoms must overcome attractive forces to separate, making it an endothermic process. In contrast, bond making releases energy as atoms form stable chemical bonds, making it an exothermic process.
The net energy change in a reaction depends on the balance between the energy absorbed during bond breaking and the energy released during bond formation. If more energy is released than absorbed, the reaction is exothermic; if more is absorbed, it is endothermic.
A key example is the combustion of methane (CH₄) with oxygen (O₂):
CH₄ + 2O₂ → CO₂ + 2H₂O
During this reaction, energy is absorbed to break the bonds in methane (C-H) and oxygen molecules (O=O).
However, when new bonds form in carbon dioxide (C=O) and water (O-H), a larger amount of energy is released.
Since bond formation releases more energy than is required for bond breaking, the overall reaction is highly exothermic.
This is why methane combustion produces heat and light, making it a useful fuel source.
Understanding bond making and breaking is crucial in chemistry, as it explains energy changes in chemical reactions, including biological metabolism and industrial processes like fuel combustion.
Bond breaking and bond making determine whether a reaction is exothermic or endothermic.
- Bond breaking is endothermic: Energy is required to break chemical bonds.
- Bond making is exothermic: Energy is released when new bonds form.
Exothermic vs. Endothermic Bond Energy Comparison
| Process | Type | Energy Effect |
| Breaking bonds | Endothermic | Energy is absorbed |
| Forming bonds | Exothermic | Energy is released |
8. Activation Energy (Ea)
Activation energy (Ea) is the minimum energy required for a reaction to proceed. It represents the energy barrier that reactants must overcome to form products.
- Lower activation energy: Faster reaction.
- Higher activation energy: Slower reaction.
9. Activation Energy Diagrams
Exothermic Reaction Activation Energy Diagram
- Reactants start at a higher energy level.
- Energy increases to the activation energy peak.
- Products form at a lower energy level than reactants.
Endothermic Reaction Activation Energy Diagram
- Reactants start at a lower energy level.
- Energy increases to the activation energy peak.
- Products form at a higher energy level than reactants.

10. Activation Energy Pathways for Specific Reactions
H₂ and O₂ Reaction (Formation of Water)
- Requires activation energy to break H-H and O=O bonds.
- Exothermic as energy is released when H₂O bonds form.
N₂ and H₂ Reaction (Formation of Ammonia – Haber Process)
- Requires high activation energy due to the strong N≡N triple bond.
- The reaction is exothermic, releasing energy as NH₃ forms.
N2 and O2 reaction (Formation of NO)
- Requires activation energy to break strong N≡N triple bond and O=O bonds.
- The reaction is endothermic, needing energy as NO forms
11. Conclusion
Energy level diagrams provide insight into reaction energetics. Enhance Understanding of exothermic and endothermic reactions, enthalpy changes, bond breaking/making, and activation energy helps in predicting reaction feasibility and control. These concepts are crucial in fields like chemistry, engineering, and environmental science.
Bond energy calculations
You can calculate the energy change in a reaction using average bond energies. Bond energy is the amount of energy needed to break one mole of a particular bond.
To calculate bond energy
- Add together the bond energies for all the bonds in the reactants – this is the ‘energy in’.
- Add together the bond energies for all the bonds in the products – this is the ‘energy out’.
- Calculate the energy change = energy in – energy out.
Worked example – an endothermic reaction
Hydrogen and chlorine combine to make hydrogen chloride gas:
H−H + Cl−Cl → 2 × (H−Cl)
| Bond | Bond energy (kJ/mol) |
| H−H | 436 |
| Cl−Cl | 243 |
| H−Cl | 432 |
- Energy Reactant side (in)= 436 + 243 = 679 kJ/mol (this is the energy needed to break bonds of the reactants ).
- Energy Product Side (out )= 2 × 432 = 864 kJ/mol (this is the energy released when the bonds of the products are formed).
- Net Energy change = Er– Ep =+679 – 864 = -185 kJ/mol
The energy change is negative, due to the fact that the energy released by the bonds formed is higher than the energy absorbed by the bonds broken. This means that energy is Given in from the surroundings in an exothermic reaction.
Please stay connected for more updates on Chemical Energetics Endothemic Reactions Exothermic Reactions